

BTC/EUR
Bitcoin
Reference
66,285.40 €
+0.04%24h
2-minute window
- Low
- 66,285.40 €
- High
- 66,333.08 €
Charts, quotes and market information gathered in a visual experience built to follow the path of the main assets. Explore cryptocurrencies, currencies, commodities, equities and indices, switch periods, follow changes and organise the instruments in your market view.
Charts · Prices · Markets · Intelligence

Bitcoin
Reference
66,285.40 €
+0.04%24h
2-minute window
Ethereum
Reference
1,841.45 €
−1.50%24h
2-minute window
USDC
Reference
0.8978 €
+0.68%24h
2-minute window
euro
Synthetic reference via USDC/EUR
US$1.11383
−0.68%24h
2-minute window
The information shown by FINOVEX Markets is informational and may reflect the time and availability of the respective data sources.
Market visualisation
FINOVEX Markets is the market-following platform of the FINOVEX ecosystem. An environment for viewing charts, reading quotes, following price changes and watching how instruments evolve through a clear, connected interface. More markets. More context. One FINOVEX experience.
View how prices evolve across different periods.
Read prices and changes for the instruments you follow.
Move across asset classes in a single platform.
Organise favourites and follow the instruments you want to watch more often.
Global markets
From Bitcoin to traditional markets. Everything starts with the chart.
Bitcoin, Ethereum and the other digital assets followed through the available sources.
International currency pairs organised for tracking and comparison.
References tied to raw materials and global markets.
Companies followed with the information available in the catalogue.
Readings that help you watch how groups and markets evolve.
Market universe
The table is a featured selection. The full catalogue covers crypto assets, currencies, commodities, equities and indices. The full catalogue and the home selection are different readings.
| Asset | Price EUR | 24h | 7 days | Market cap EUR |
|---|---|---|---|---|
| BTCBitcoin Coinbase Exchange | 66,285.40 € | +0.04% | −5.46% | 1.33tn € |
| ETHEthereum Coinbase Exchange | 1,841.45 € | −1.50% | −11.42% | 225.00bn € |
| USDTTether USDt Coinbase Exchange | 0.8971 € | +0.72% | +0.03% | 157.81bn € |
| BNBBNB | 610.46 € | −1.02% | −2.80% | 80.28bn € |
| USDCUSDC Coinbase Exchange | 0.8978 € | +0.68% | 0.00% | 62.74bn € |
| XRPXRP Coinbase Exchange | 0.9447 € | −1.75% | −17.59% | 60.05bn € |
No price reference in this query. This reading did not include the catalogue. Try again later or open Markets in your account.
Quotes: CoinMarketCap and Coinbase Exchange. Observed at 11/11/2026, 12:28 UTC, in EUR.
The information shown by FINOVEX Markets is informational and may reflect the time and availability of the respective data sources.
Each price tells part of the story. The chart shows the path.
FINOVEX Charts
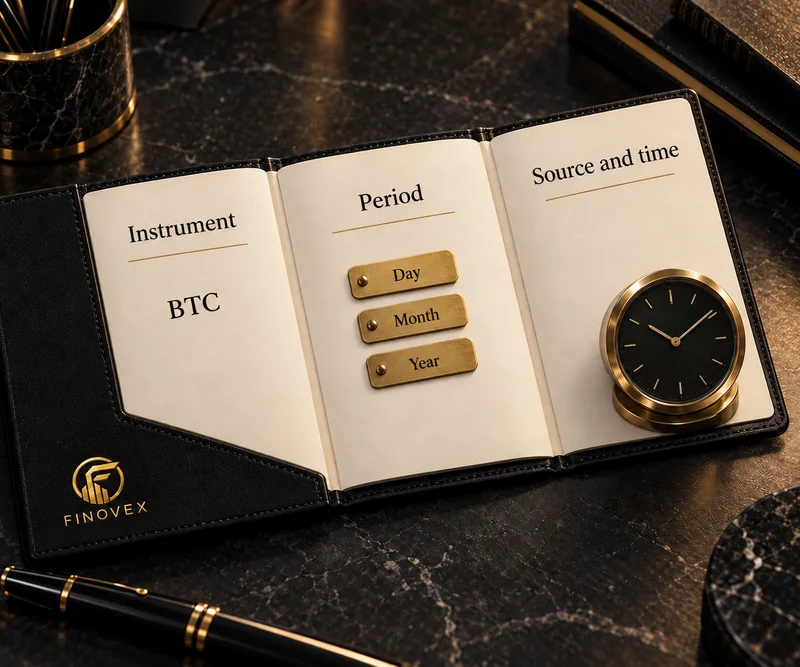
Select an instrument, choose the period and watch its path on charts built to make the reading simpler and more visual.
Your view
Build a selection of the instruments you follow most and keep it in your FINOVEX account. The market is global. Your view can be personal.
Keep the instruments you want to revisit more often.
Organise sets of instruments inside the account.
Set a price condition. The alert reports when the platform observes that condition.
Start here
From the first lookup to the panel, with no extra step beyond the reading itself.
Look up instruments and quotes directly on the platform.
Choose the asset and the period you want to watch.
Add instruments to favourites and lists.
Return to the panel and watch the markets in your selection evolve.
One ecosystem. Different experiences.
Markets shows charts and quotes. FINOVEX Investments, FINOVEX Intelligence, FINOVEX Mining, FINOVEX Token, FINOVEX Partners, Exchange, Academy and Insurance carry other roles in the same ecosystem. Different experiences. One FINOVEX ecosystem.

FINOVEX Markets
Charts, quotes and different asset classes gathered in a visual experience built to follow global markets.